AERMOD · in your browser
AERMOD, with the data already in it.
- Weather stations, background monitors, land cover, terrain and Class I areas, already on the map.
- Ten scenarios running at once in the cloud, while you keep working.
- The application’s tables and figures, assembled from the runs.
$199 a month · compute hours that never expire · cancel anytime
What you no longer do
| Step | The usual way | On PlumeSmart |
|---|---|---|
| Weather | The usual way: Find a station; download surface, upper-air and one-minute wind files; run AERMINUTE, AERSURFACE and AERMET | On PlumeSmart: Stations by distance with data completeness; weather built on demand, at no charge |
| Background | The usual way: Download monitor data; compute design values and profiles in a spreadsheet | On PlumeSmart: EPA monitors ranked on a map; design values already in each standard’s form |
| Runs | The usual way: Runs queued on one desktop computer | On PlumeSmart: Ten scenarios at once on cloud machines; time and compute hours shown first |
| Tables and figures | The usual way: Results copied into spreadsheets; reference layers from a separate GIS | On PlumeSmart: Application tables and figures assembled from the runs |
| Site setting | The usual way: County, attainment, Class I areas and permitting agency looked up on separate websites | On PlumeSmart: Read from the facility’s position on the first step |
| Intermittent sources | The usual way: Hourly emission files built by hand | On PlumeSmart: Monte Carlo analysis on the run’s results |
| Comparing designs | The usual way: Two output files read side by side | On PlumeSmart: Two runs on the map: difference, swipe or outline |
| Class I | The usual way: Boundaries and receptor arcs placed by hand | On PlumeSmart: Areas, 50 km arcs and Park Service receptors placed for you |
The site, already mapped
Every layer opens on the Facility and Spatial analysis maps, beside your sources and receptors.
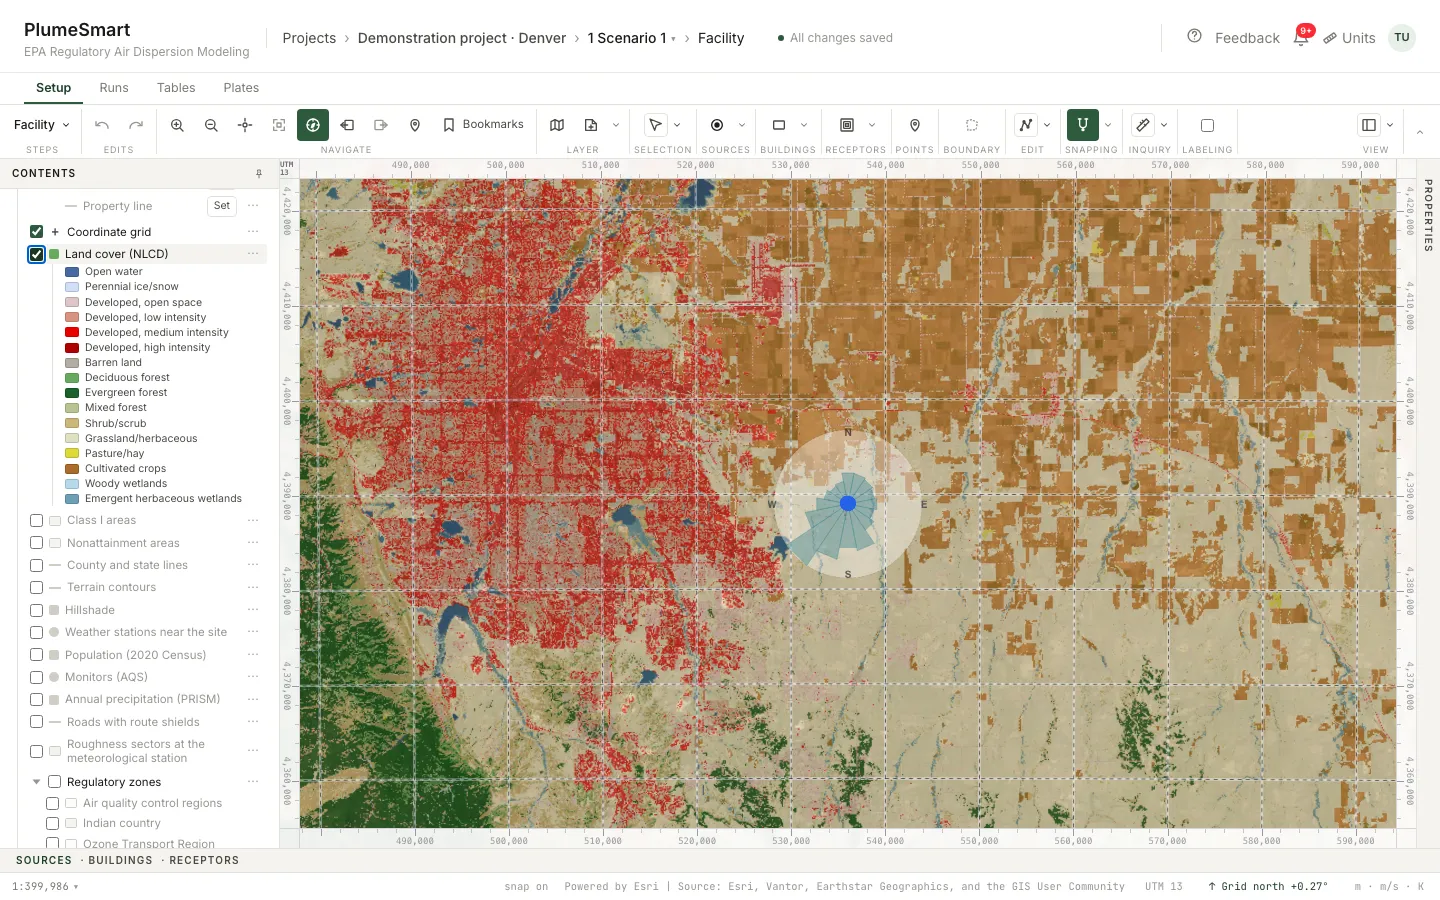
USGS land cover: the data AERSURFACE reads.
Land cover (NLCD)
USGS land cover: the data AERSURFACE reads.
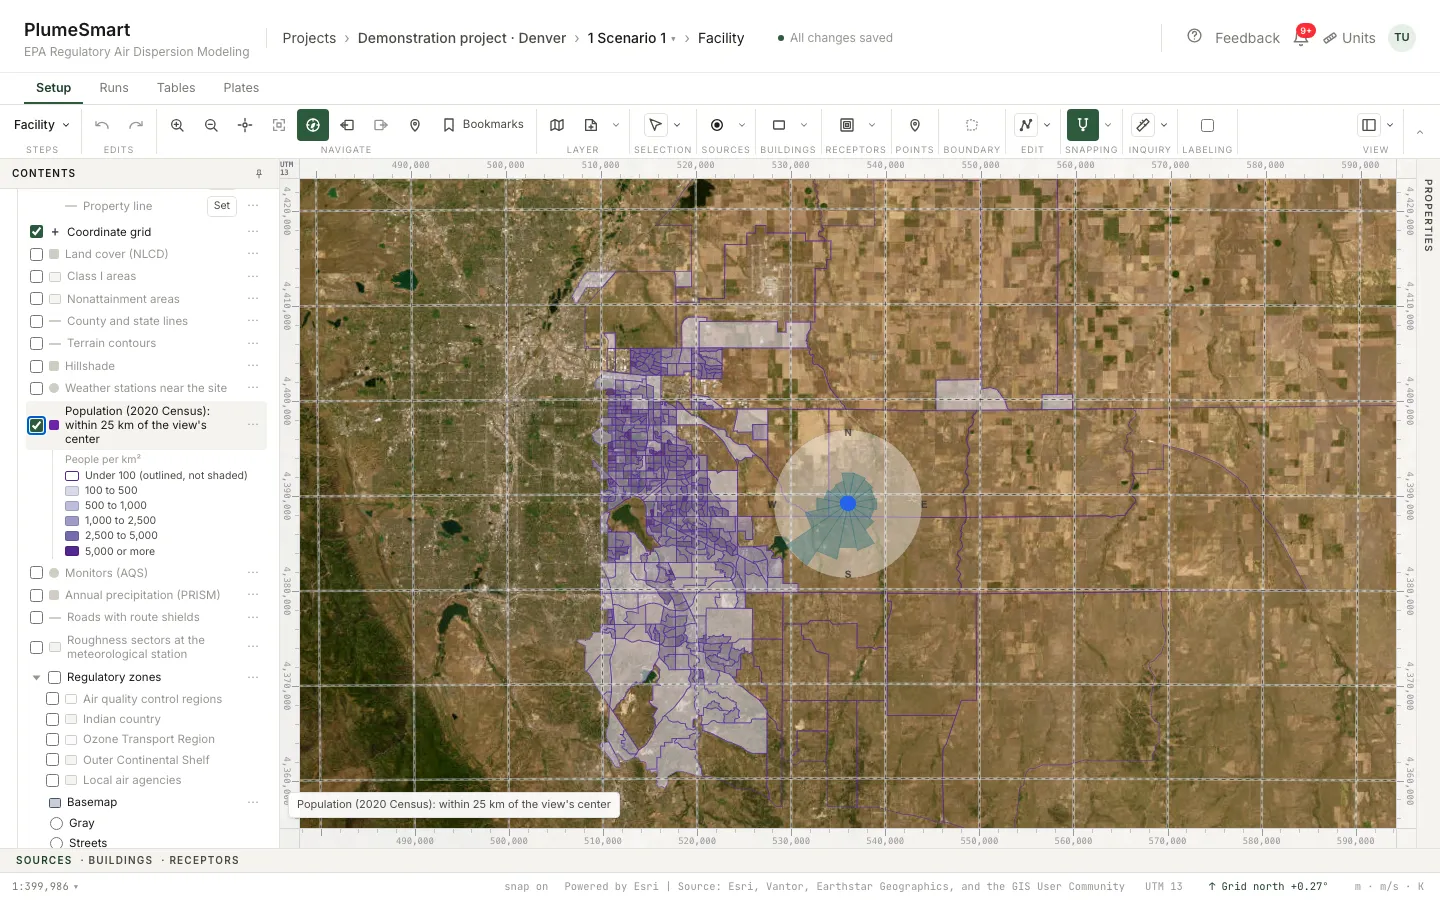
Population (2020 Census)
People by block group, and the count inside each contour.
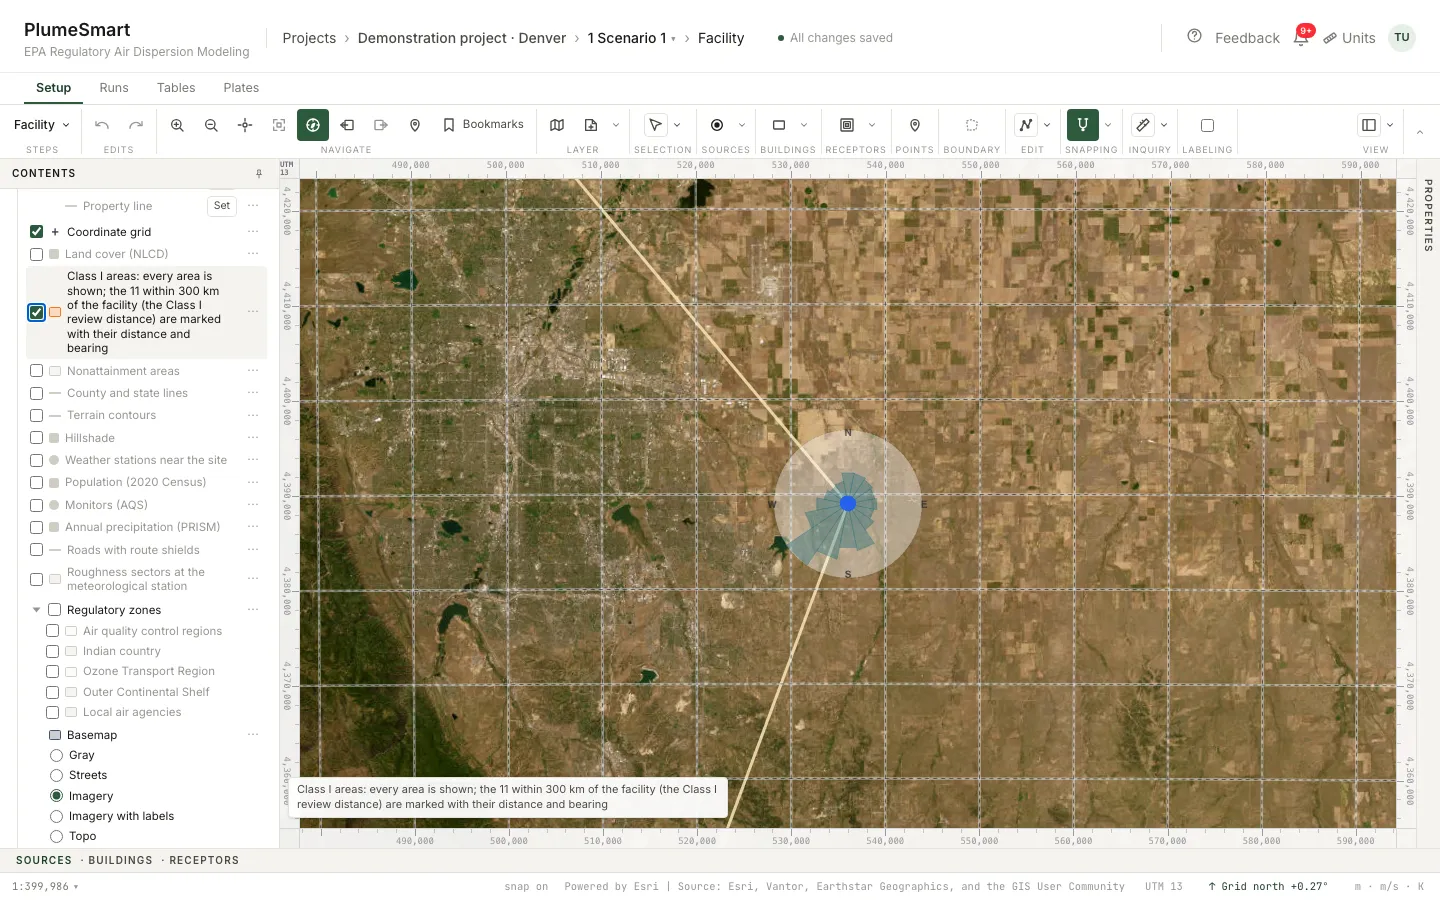
Class I areas
Boundaries, bearings and the Park Service’s Class I receptors.
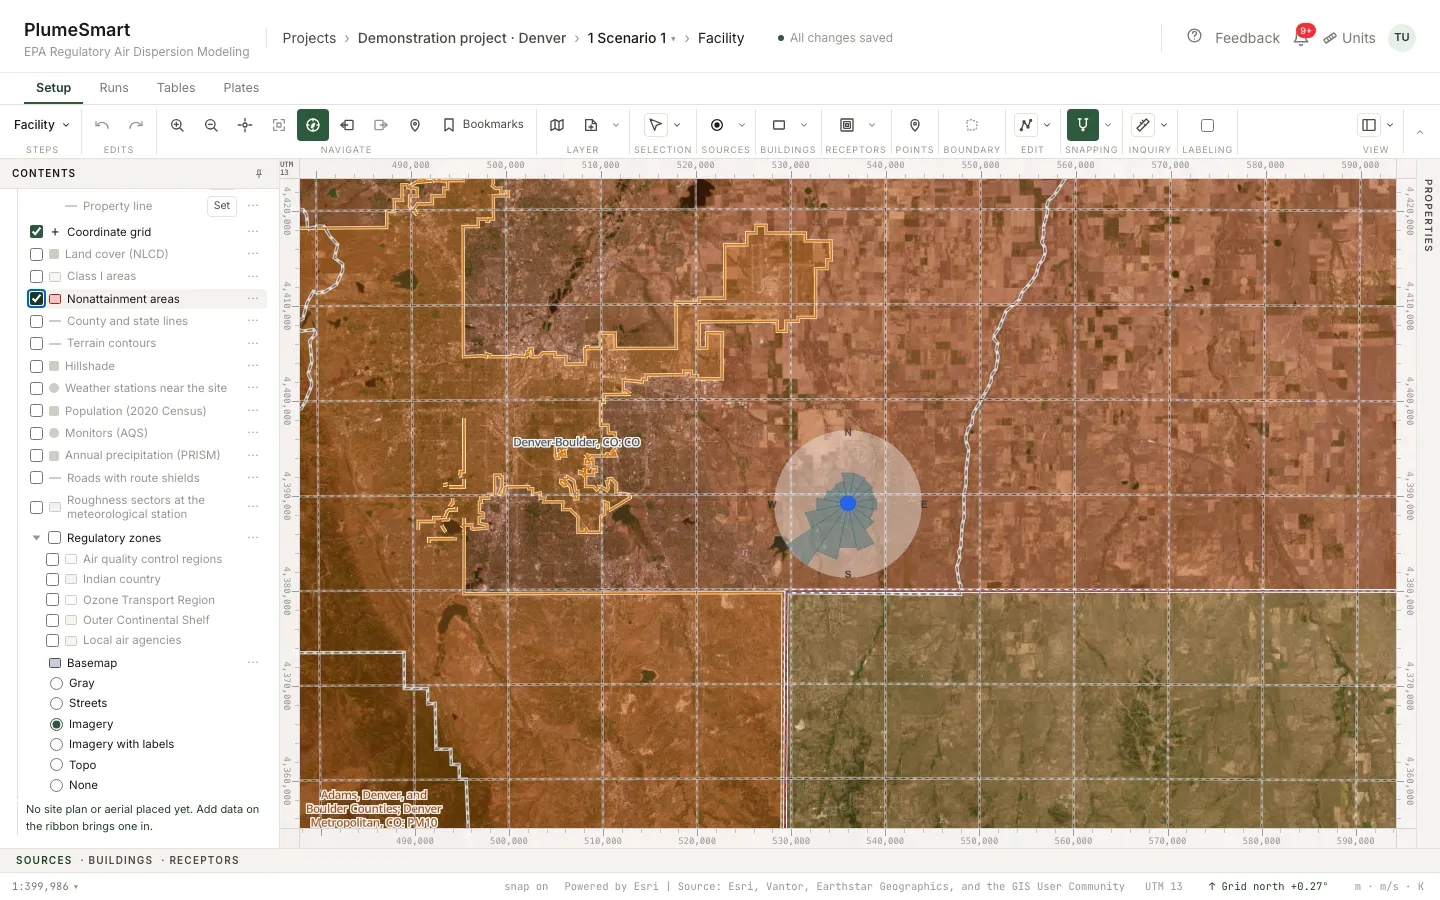
Nonattainment areas
EPA’s designations within 150 km, by pollutant.
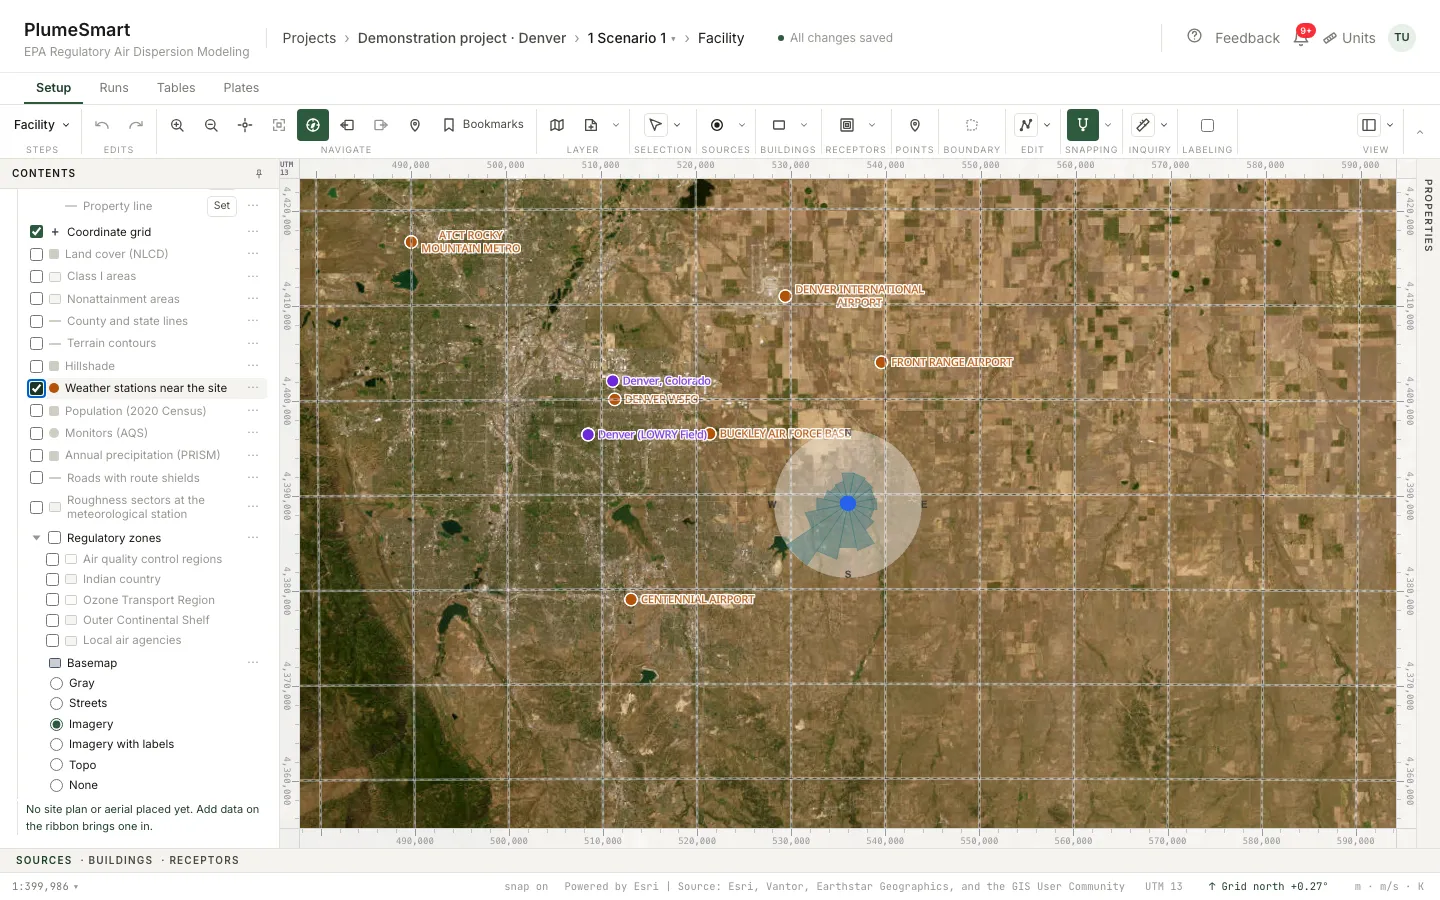
Weather stations near the site
Surface and upper-air stations, ranked on the Meteorology step.
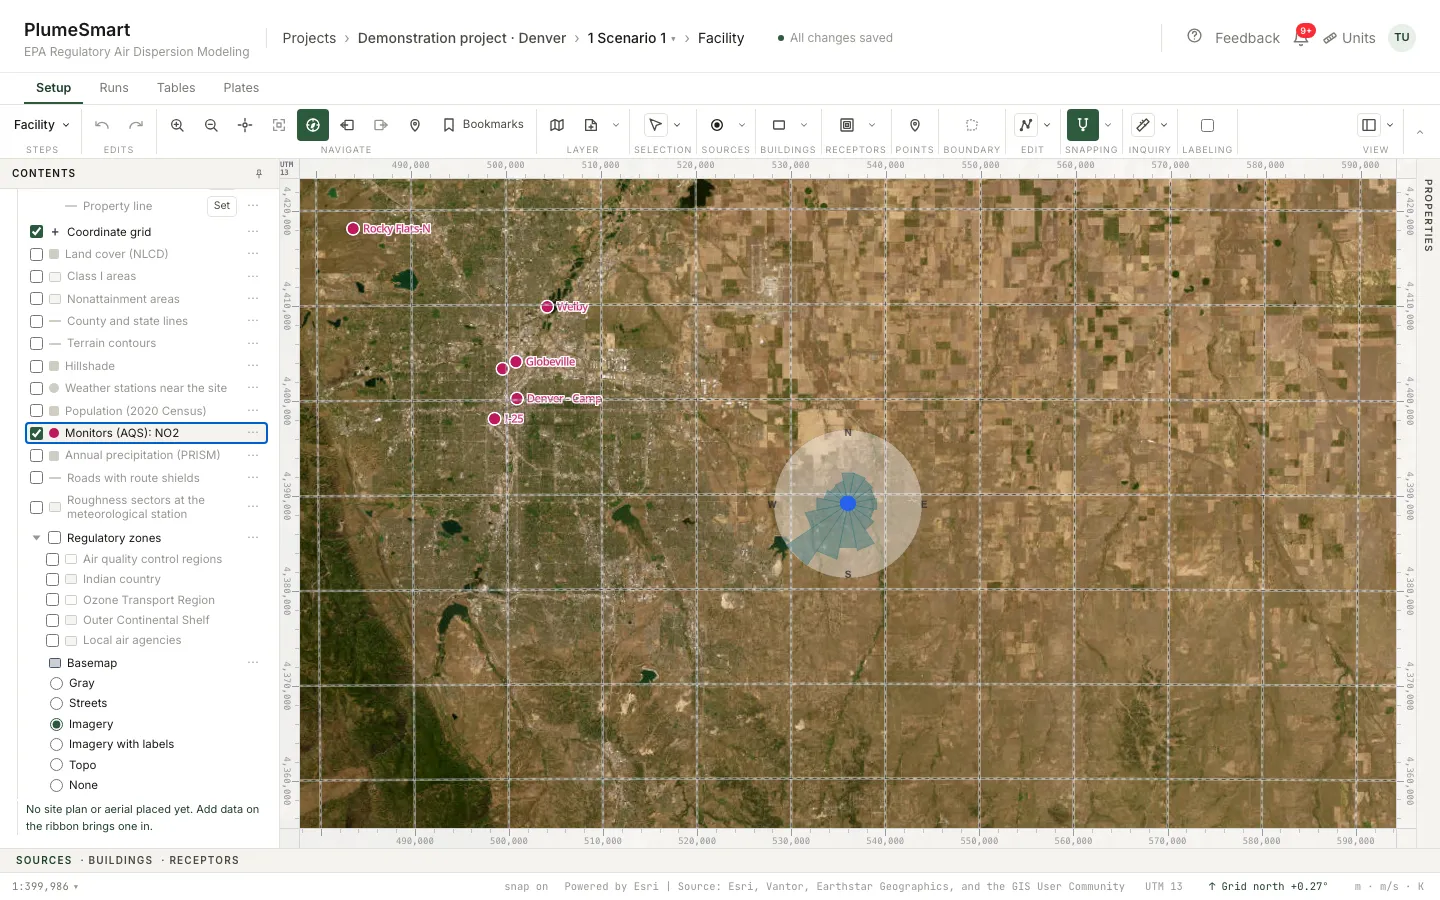
Monitors (AQS)
EPA monitors with their design values, ranked on the Background step.
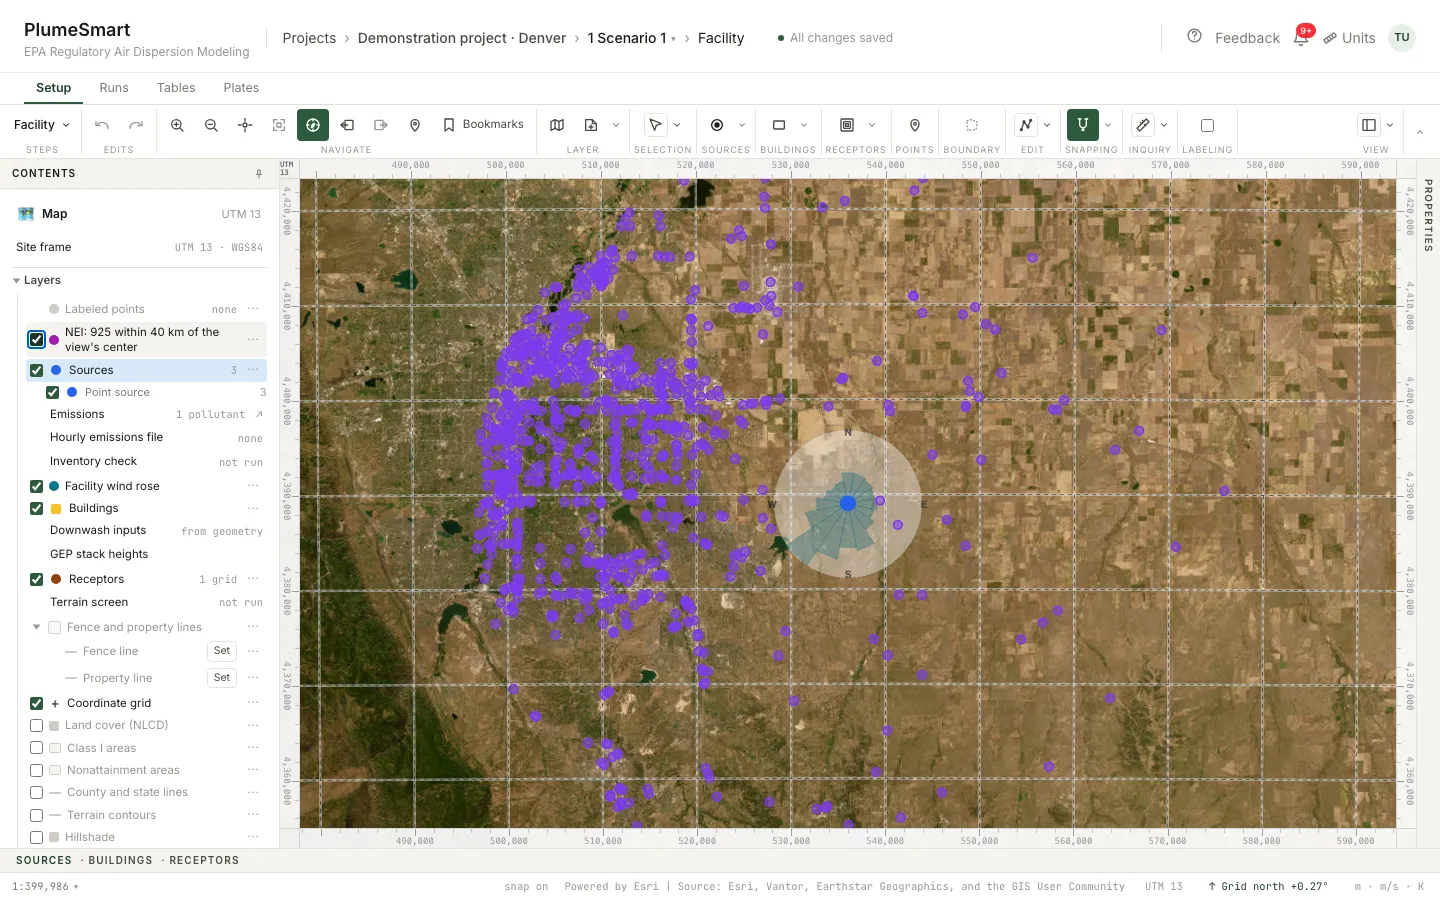
NEI neighbors
Facilities in EPA’s emissions inventory; add one as an inventory source.
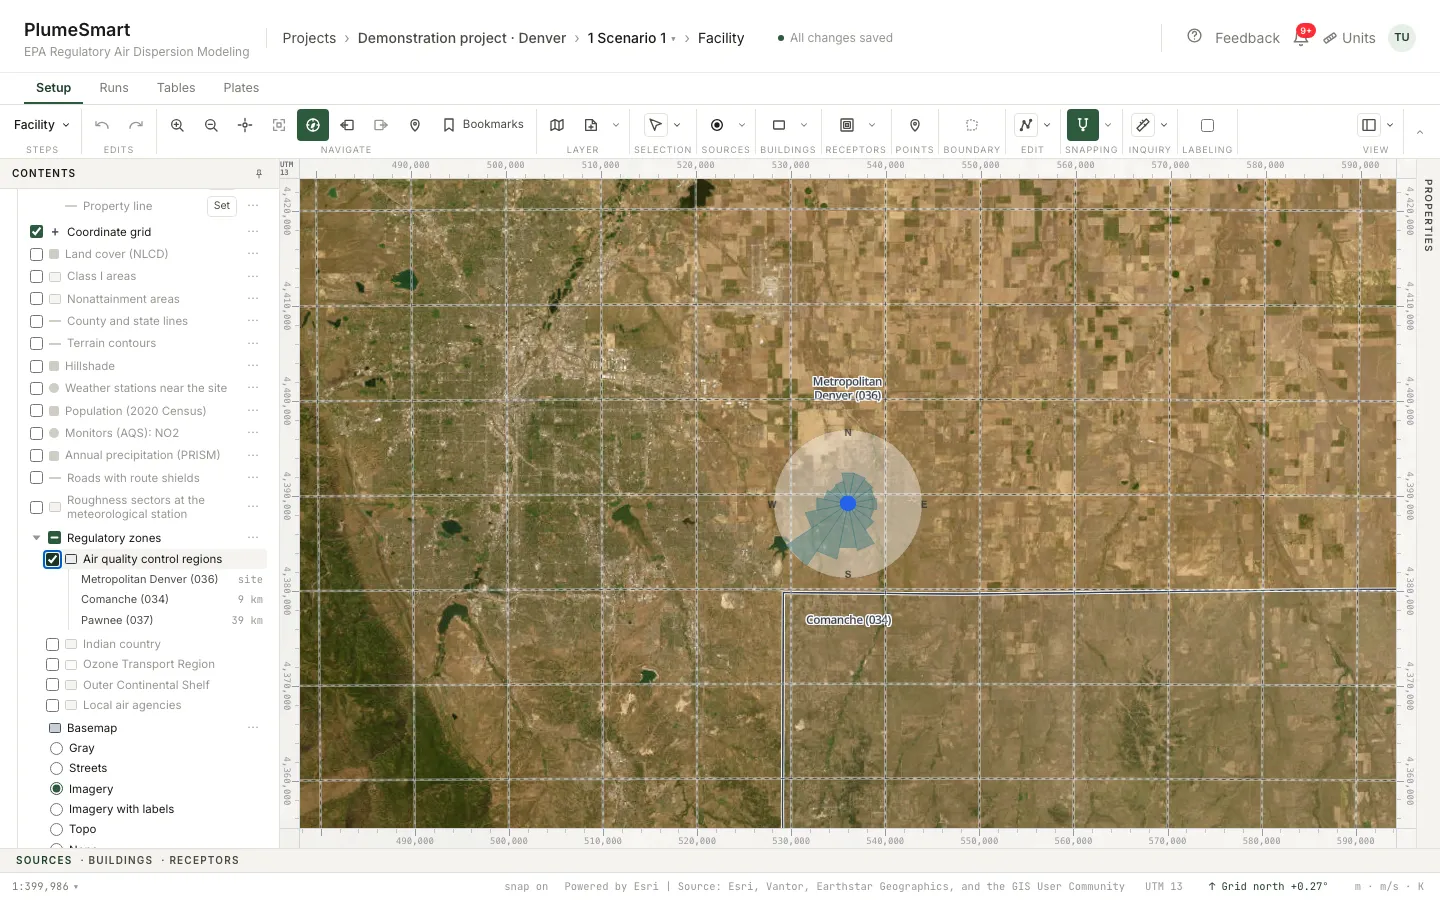
Regulatory zones
Air quality control regions, Indian country, the Ozone Transport Region, the Outer Continental Shelf, local air agencies.
Terrain contours
USGS 3DEP elevation; AERMAP elevations computed in the run.
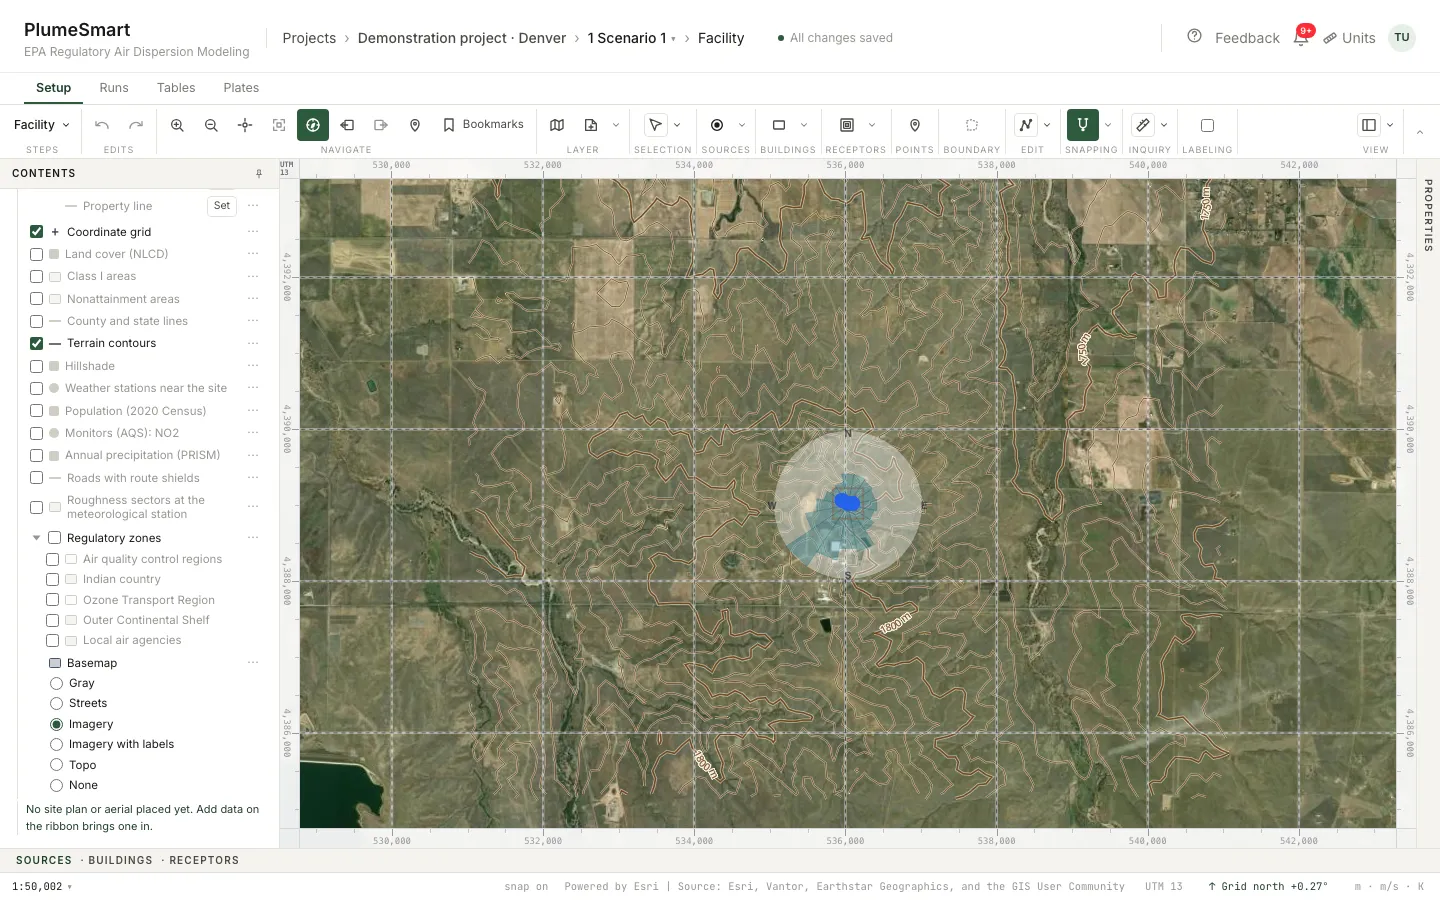
Imagery
Aerial imagery, streets, topography or plain gray behind the model.
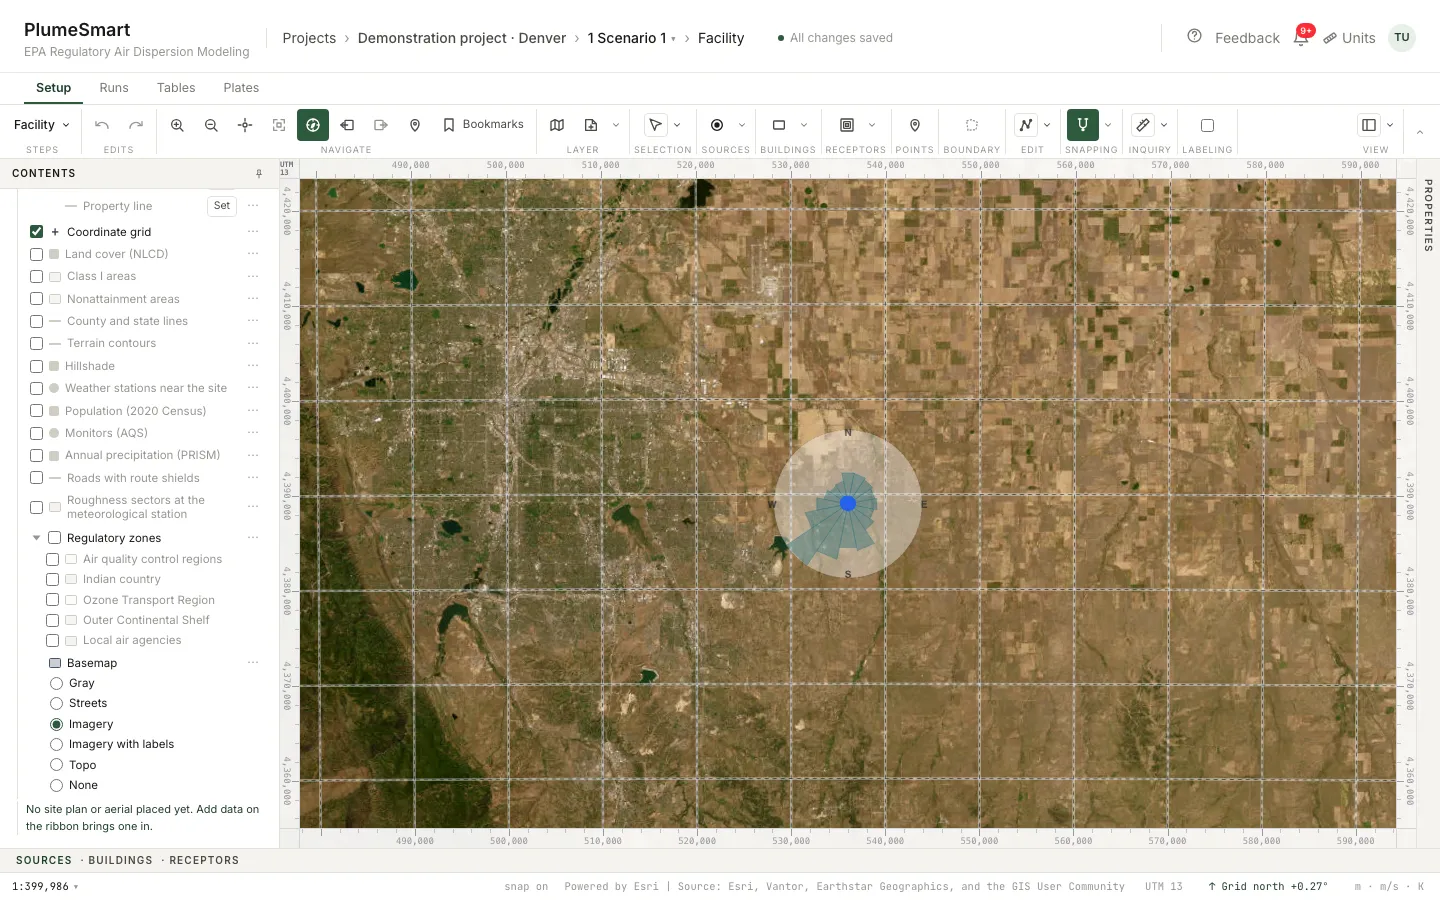
County, attainment status, Class I distances and the permitting agency are read from the facility’s position on the first step.
Weather and background, chosen on the evidence
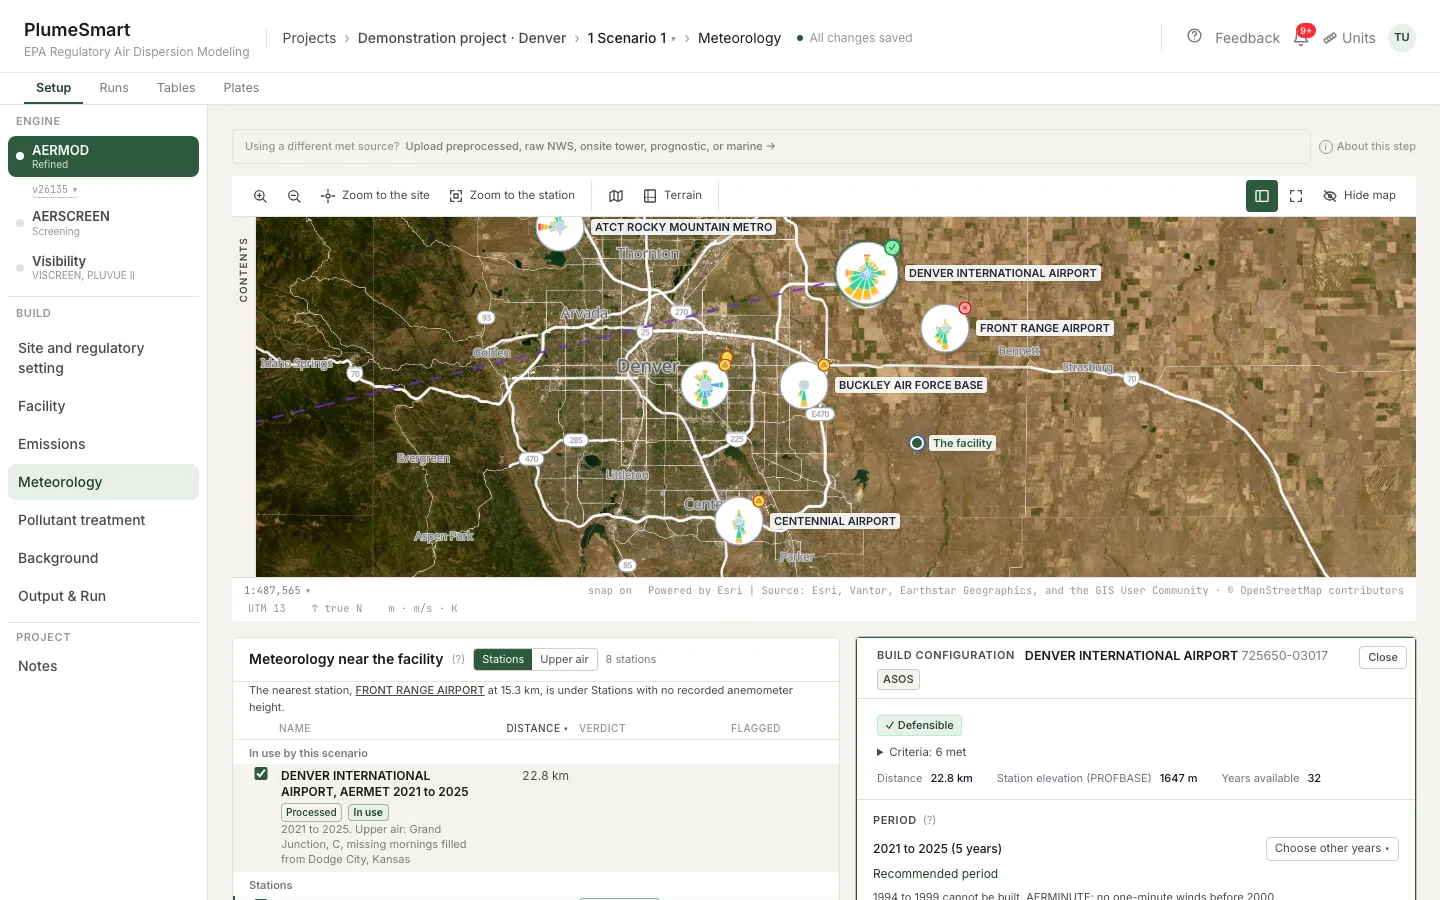
- Every station near the site, by distance, with data completeness.
- Each marked Defensible or Requires justification.
- Wind roses of nearby stations, side by side.
- Processed weather built from NOAA’s records. No charge.
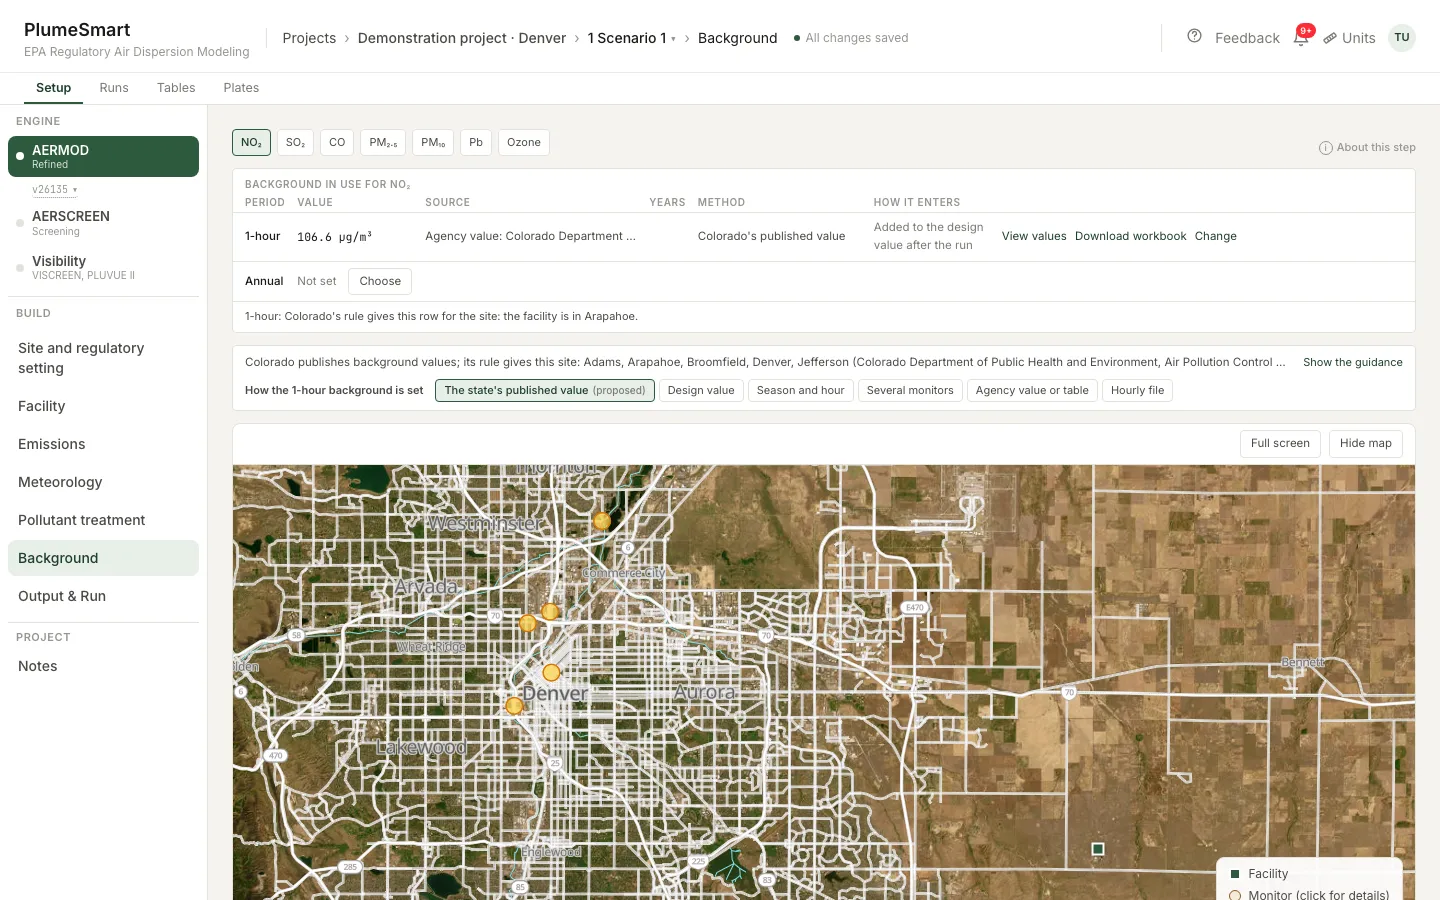
- EPA monitors ranked for the site, each Defensible or Usable with justification.
- Design values already in each standard’s form.
- Seasonal and hour-of-day profiles from the monitor’s own record.
- Hourly ozone for NO₂ chemistry, every filled hour stated.
Ten scenarios at once, in the cloud
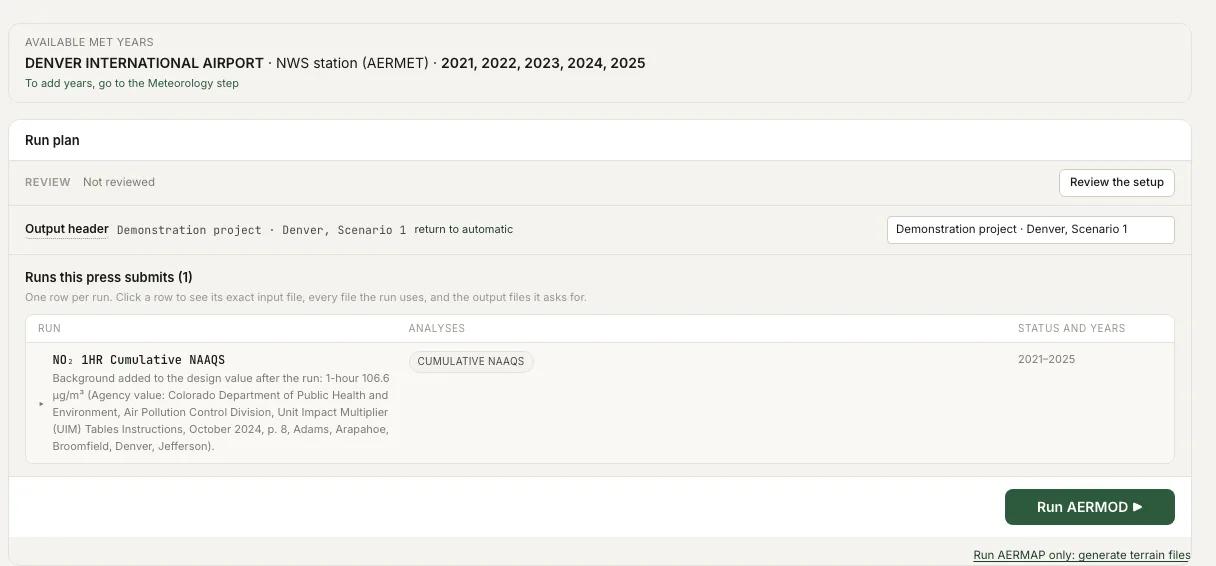
- Press Run on up to ten scenarios at once; more wait their turn.
- Each run is divided across cloud machines by year and receptor.
- Close the browser; the runs go on. Follow them from your phone.
- Compute hours and time to results are shown before you press Run.
- Several projects open in several tabs.
Compare and explain
- Two runs on the map: difference, swipe or outline.
- Each source group’s share of the controlling value.
The application, assembled from the runs
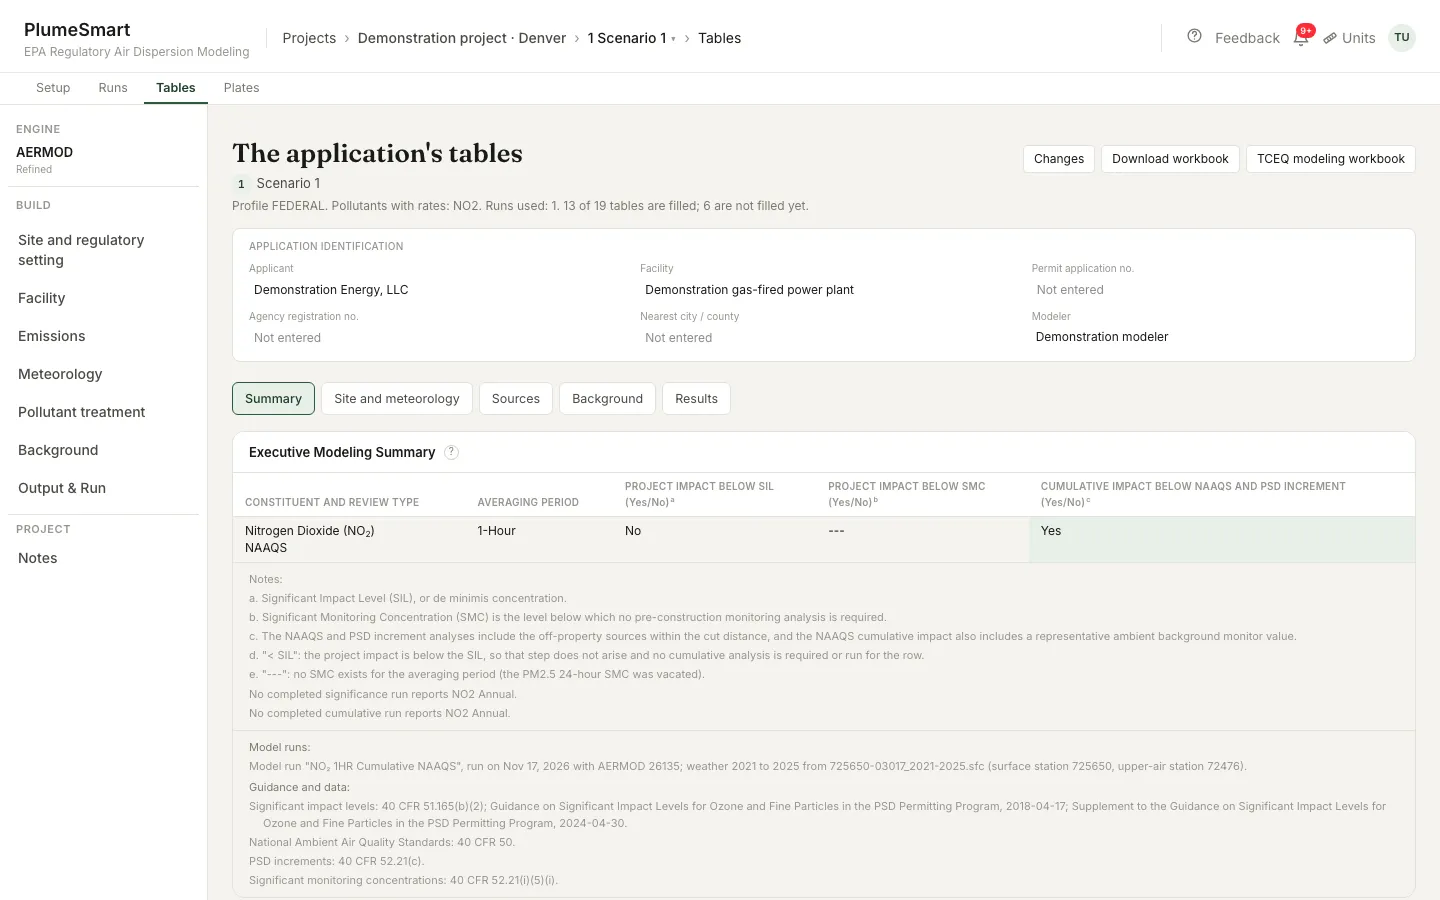
Significance, NAAQS, increment, Class I and GEP stack height tables, in the application’s form.
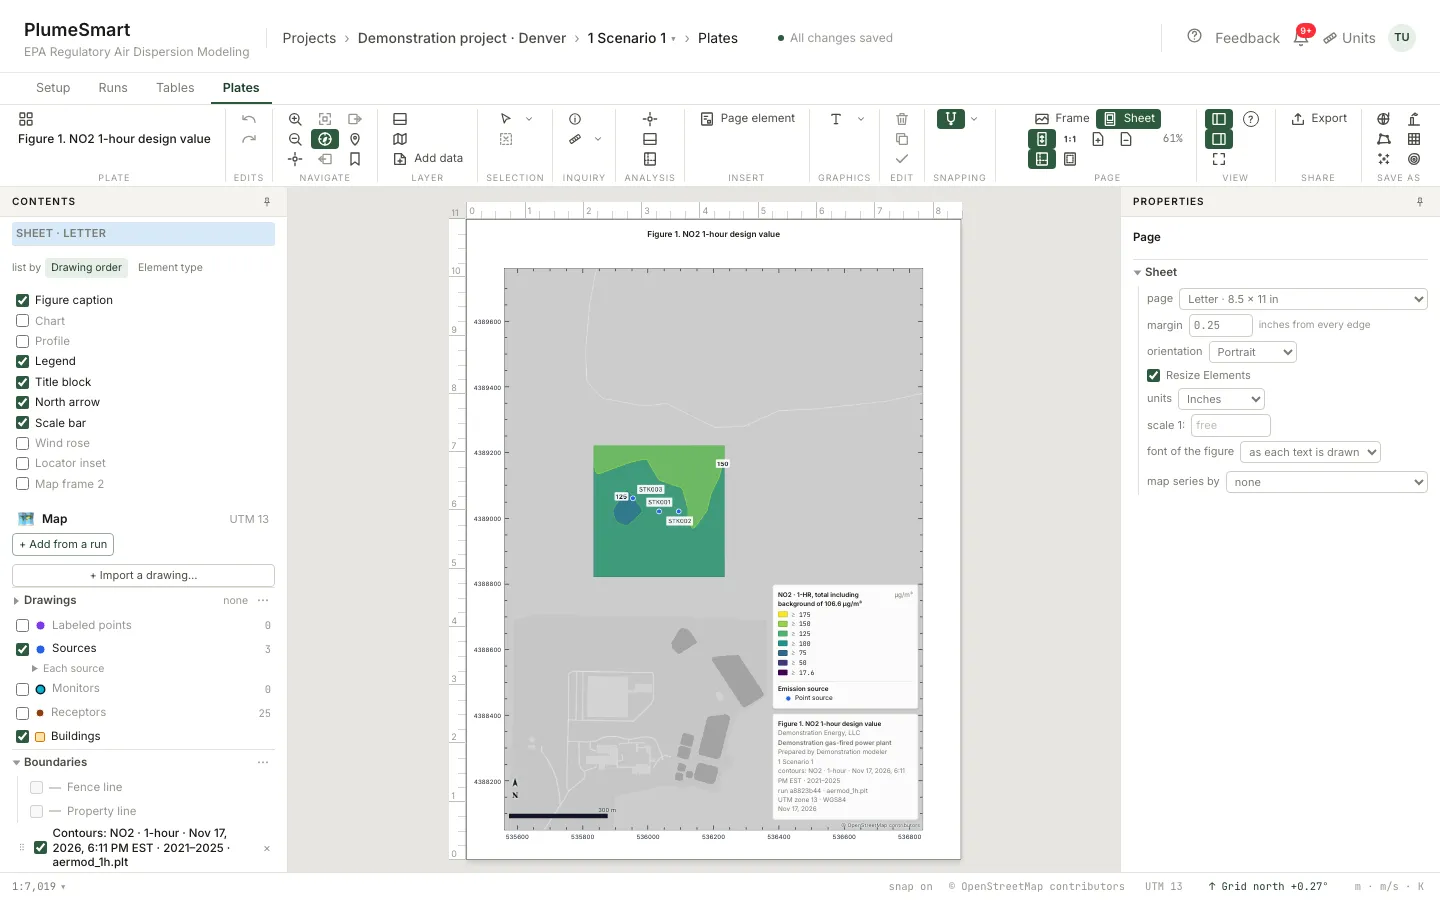
Figures with title block, legend, north arrow, scale bar and the reference layers.
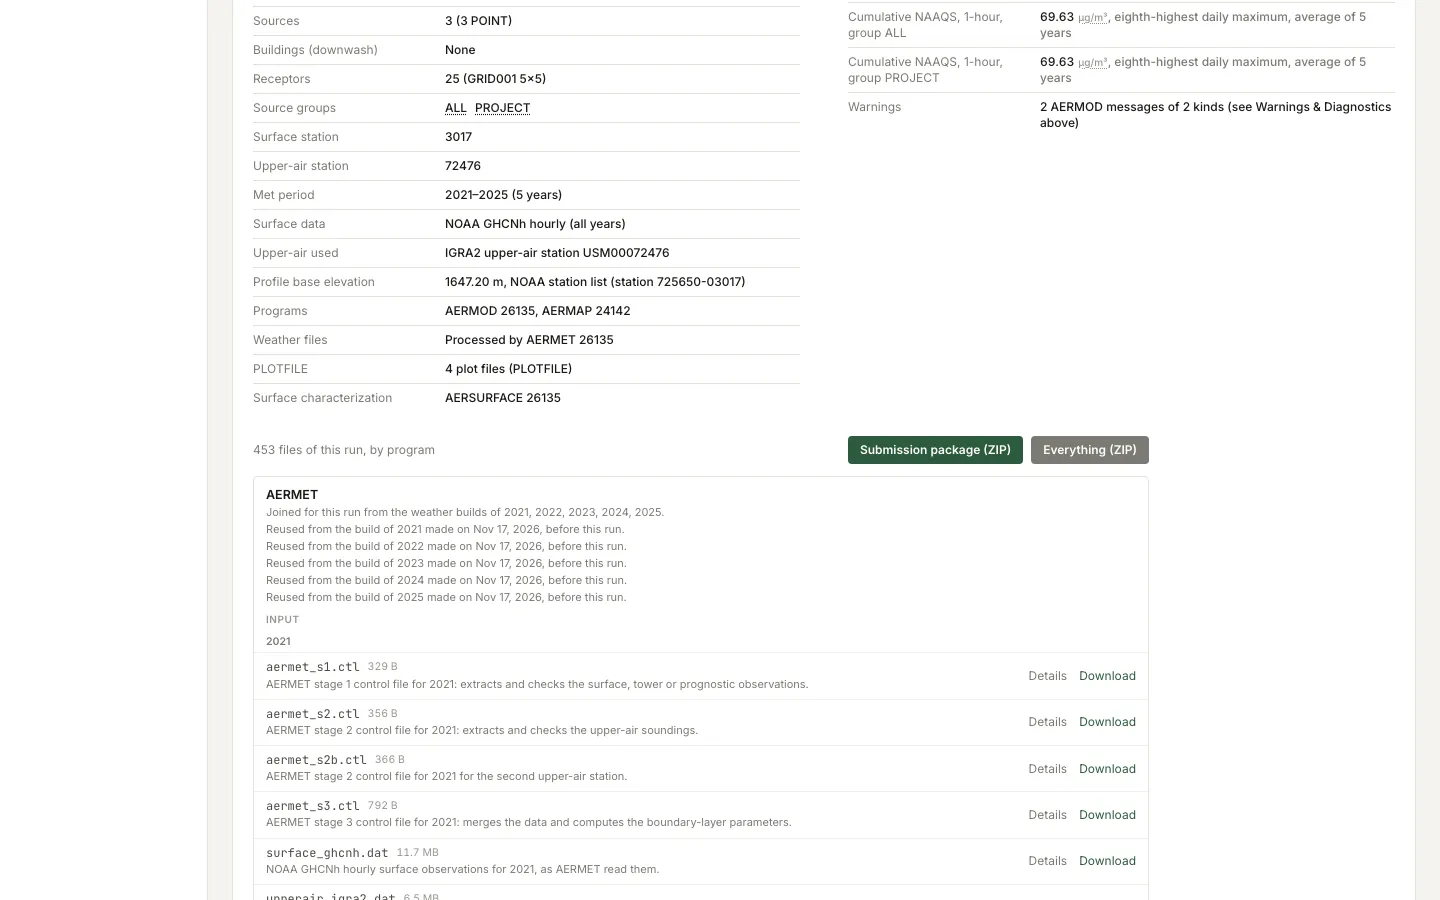
The submission package: every input and output file, with checksums and program versions.
Intermittent sources: a Monte Carlo analysis on the run’s results.
Population inside each contour, for the figures that need it.
Everything in one subscription
| Part of the filing | On PlumeSmart |
|---|---|
| Data on the map | |
| Weather | NOAA surface, upper-air and one-minute wind records; your own files; onsite towers |
| Background | EPA design values and hourly monitor records; seasonal and hour-of-day profiles |
| Site | County, attainment status, regulatory zones, permitting agency, Class I review |
| Layers | Land cover, population, Class I, nonattainment, monitors, stations, NEI facilities, terrain, imagery |
| Build the model | |
| Sources | 13 AERMOD source types, drawn on the map, imported or pasted |
| Drawings | Plot plans (PDF, image, CAD), shapefiles, KML, GeoJSON |
| Existing models | AERMOD, BPIPPRM and AERMAP input files, imported by part |
| Buildings | BPIPPRM downwash; GEP stack height tables |
| Receptors | Fence line, nested grids, discrete points, Class I arcs |
| Run it | |
| Analyses | Significance, cumulative NAAQS, PSD increment, Class I |
| Pollutants | NO₂, SO₂, PM₁₀, PM₂.₅, CO, lead |
| NO₂ methods | Full conversion, ARM2, OLM, PVMRM, GRSM, TTRM, TTRM2 |
| Runs at once | 10 (Enterprise 20) |
| Versions | AERMOD 26135; any scenario can be pinned to 24142 |
| File it | |
| Tables | Significance, NAAQS, increment, Class I and GEP tables |
| Figures | Plates with title block, legend, north arrow, scale bar |
| Report | Printable modeling report from the run’s own files |
| Package | Every input and output file, checksums, program versions |
| Further analyses | |
| Intermittent sources | Monte Carlo 1-hour NO₂ design value |
| Screening | AERSCREEN |
| Health risk | Multipathway risk (EPA HHRAP): cancer risk and hazard index |
| Visibility | VISCREEN Levels 1 and 2; PLUVUE II Level 3 |
| Secondary formation | MERPs for ozone and secondary PM₂.₅ |
One subscription covers every row. Compute is drawn from prepaid hours.
One subscription. No hardware, nothing to install.
| Platform | $199 a month, or $1,990 a year |
| Compute | $0.25 to $0.22 a compute hour, in packs of 100 to 10,000 hours |
| Compute hours | Never expire |
| Storage | 25 GB included |
| Weather processing | No charge |
| A run that fails | No charge |
| Several modelers, shared projects | Enterprise |
| Invoice and purchase order | Enterprise |
The compute hours a run will draw are shown before you press Run.
See pricingYour data
- Encrypted in transit and at rest.
- Each account’s projects and runs are isolated from every other account.
- We do not sell your data.
- Export any project, with the runs you choose, at any time.
- After a cancellation, your files stay available to download for six months.
The programs are EPA’s, compiled from EPA’s published source, and each reproduces EPA’s own test cases before every release.
Questions modelers ask
Do I still download weather data?
No. Choose a station; its weather is built from NOAA’s records already held. Your own files are accepted too.
Where does the background come from?
EPA’s design values and monitor records, held and ranked for your site.
Do I still need GIS software?
Not for the model or its figures. Shapefiles, KML and GeoJSON come in; contours go out as KMZ, GeoJSON, SVG and shapefile.
How many runs can I make at once?
Up to ten presses of Run at once, five of them long runs; more wait their turn. Enterprise: twenty.
What does a run cost?
Each run draws compute hours from your prepaid balance. The estimate is shown before you press Run; a run that fails draws nothing.
Can I bring in an existing model?
Yes. AERMOD, BPIPPRM and AERMAP input files, spreadsheets, CAD drawings and shapefiles come in on the step where each belongs.
Are the numbers EPA’s?
Yes. The programs are compiled from EPA’s published source and reproduce EPA’s own test cases before every release.
Will the agency accept a run made here?
The agency receives the standard AERMOD input and output files and can run them itself.
Can colleagues share projects?
Yes, on Enterprise: an organization, its members and shared projects. The individual plan is one person.
Built for the modeler who signs the report.
Subscribe and open your first project today.
How to start
- Subscribe on Pricing.
- Create your login with the email that paid; a sign-in link arrives by email.
- Build the scenario. Its input files need no compute hours.
- Buy compute hours when you are ready to run.
Questions: [email protected]